What is iCRCexp
Here, we developed the iCRCexp database to integrative database of ColoRectal Cancer gene expression profile based on the TCGA and NCBI GEO databases. In total, 18466 tissue samples in 231 studies, 2429 CRC-related genes, and 1852 CRC-related drugs are collected and integrated in the iCRCexp database.iCRCexp database could serve as a comprehensive analysis tool to conduct differential, correlation and survival analyses. Meanwhile, it also can be used to predict potential target drugs for CRC-related genes by calculating connectivity scores. Consequently, iCRCexp database was a comprehensive resource for the CRC community, including CRC-related gene and medication information and an expression analysis platform.
How to use iCRCexp
Quick Search
In the home page of iCRCexp, users can access to the corresponding analysis screen by simply clicking the GENE, DRUG, OR ANALYSIS Buttons.

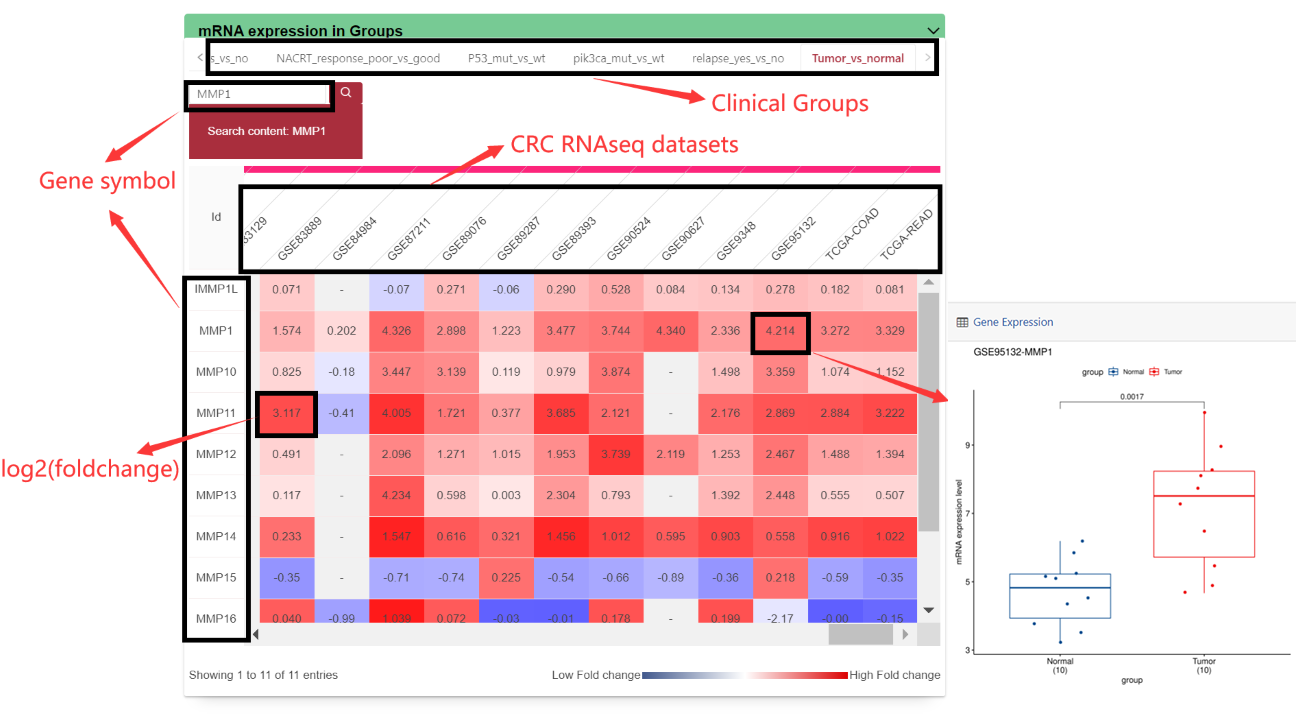
Gene
In the Gene page, users can click one term to browse the differential expression of genes of interest in each dataset using the search function. By ‘click’ the box, we can enter another webpage that would show the box plot of the differentially expressed level of interest gene in the group. The box plot was annotated using the sample size of the two groups and p-value of the differential analysis.
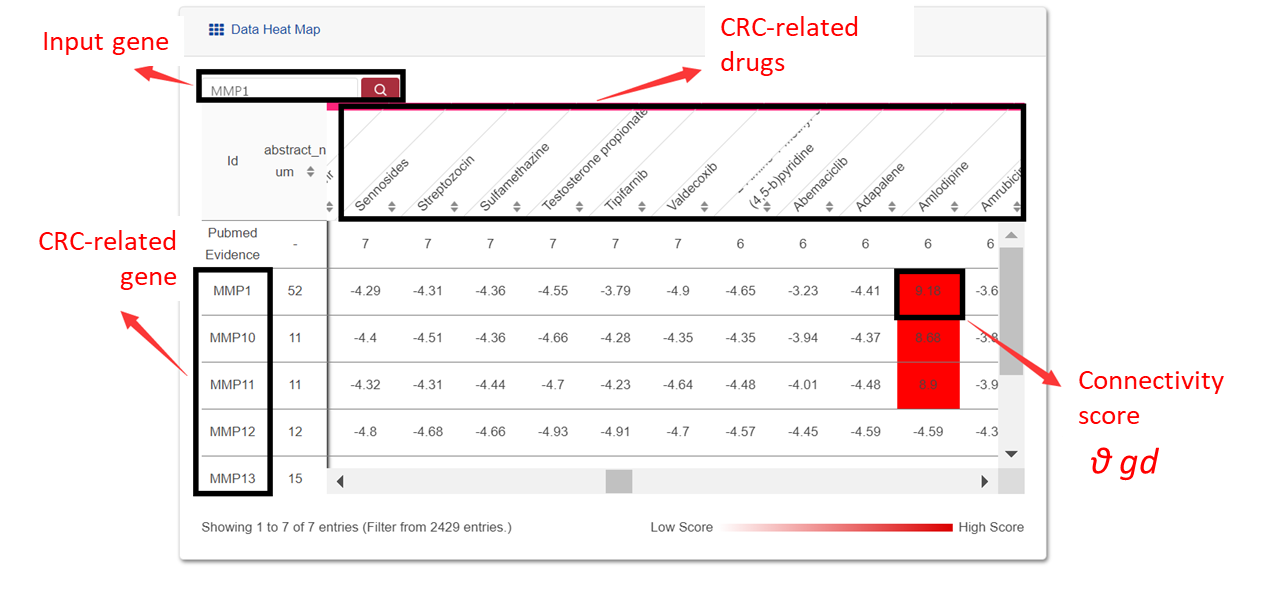
Connectivity Map
In the Connectivity Map page, users can explore the Connectivity Map by inputting genes or drugs into a search box. When the 'connected score' is greater than zero, we believe that the drug can be used as a potential target drug for the specific gene.
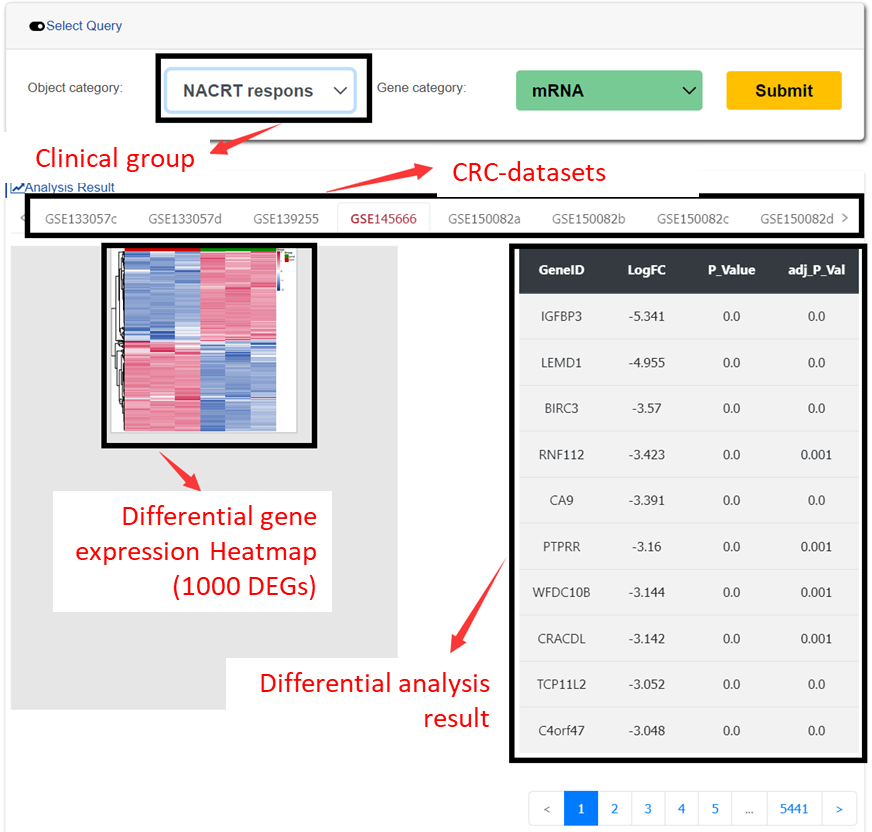
Analysis
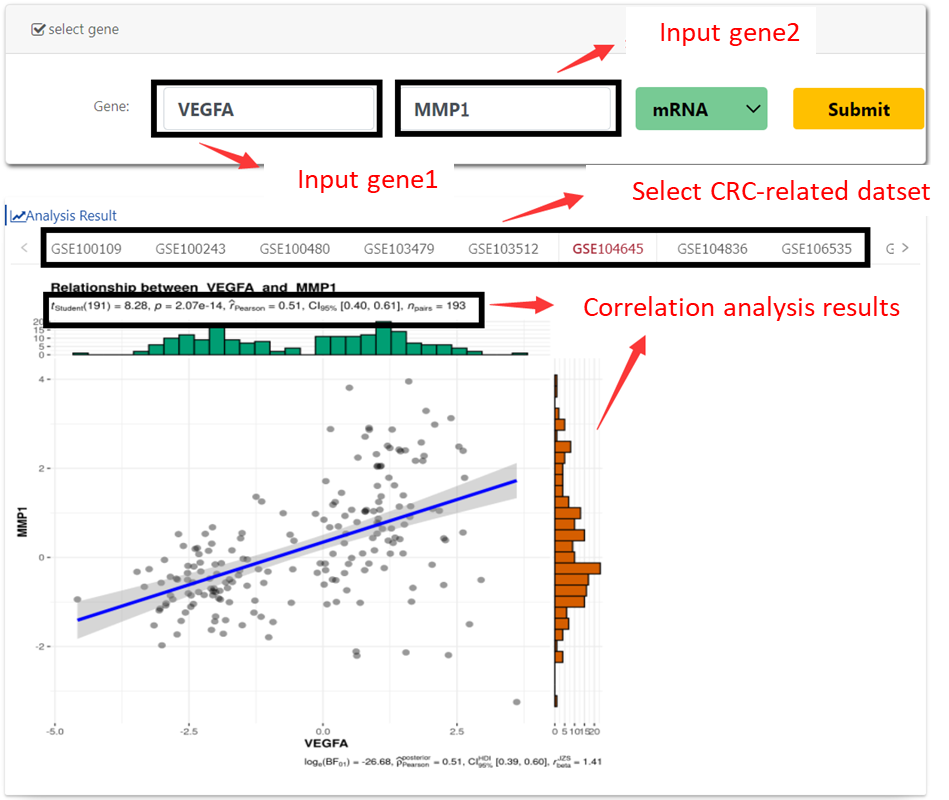
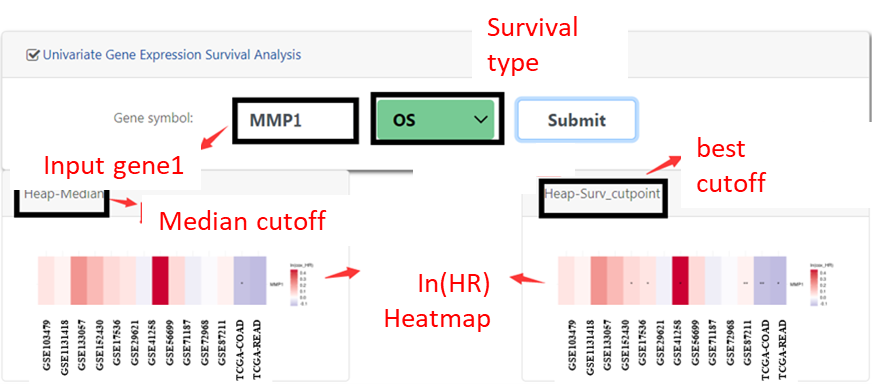
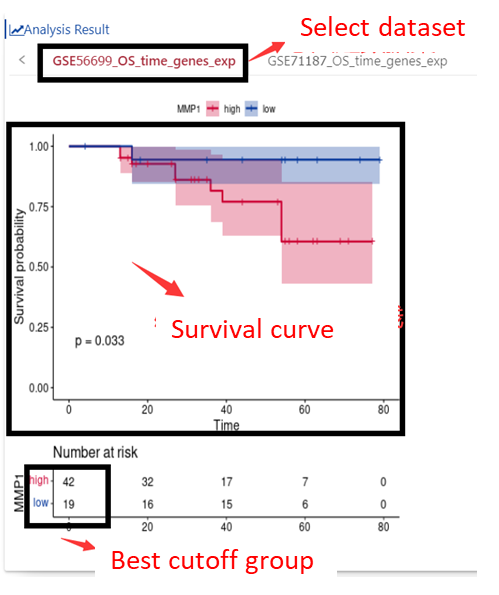
In the Analysis page, users could read and download the differential expression result table of the specific dataset in a specific group by clicking the ‘show results,’. By inputting two specific genes into the correlation analysis, a scatter plot showing the correlation between these two genes was generated. Users can explore the expression correlation coefficients and correlation P values between two specific genes in the selected datasets. In the survival analysis, users can explore the prognostic value of a specific gene in CRC-related datasets by inputting a gene symbol and selecting a survival type. The results included two heat maps and one Kaplan-Meier survival curve. Two heat maps were drawn using the natural logarithm of the univariate Cox hazard ratio and the p-value of the log-rank survival analysis using two different grouping methods. The color of the heat map was defined as the natural logarithm of the univariate Cox hazard ratio value. One grouping method for gene expression was based on the median value (heat map shown on the right). The other grouping method was based on the best cut-off value (left heatmap). The Kaplan-Meier survival curve was drawn based on the best cutoff value of the gene expression level.